Phase II results, with almost 100 participants, were devastating. FX-322 showed no signal at all, with no difference between drug and placebo. FX-322 simply worked no better than sugar water.


I thought about it by looking at the two slides of the latest presentation.
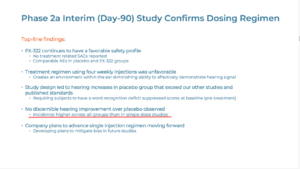
Slide 16 states "Incidence higher across all groups than in single dose studies".
And it has been described as "No discernible hearing improvement over placebo observed."
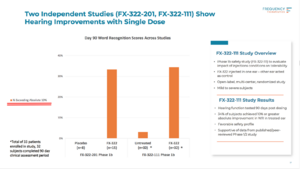
Let's make a Phase2a graph under the condition of "Exceeding Absolute 10%" like the graph of Slide 17. The graph would look like 40% (placebo), 55% (x1), 50% (x2), 45% (x4), for example.
In this case, for example, if you change "Exceeding Absolute 10%" to "Exceeding Absolute 20%", can you see a more accurate difference between the drug and the placebo?
Isn't 10% their standard as well as 10 dB in PTA?
Attention:
Are cheaters evenly distributed in each group?
Are each fraud about the same?(40 word→ 30 word? 40 word→ 20 word? etc)
What's the impact of the the ceiling effect?
In the "final report", I would like you to show me the corrected version of the "Interim report" .

 Member
 .
.

